

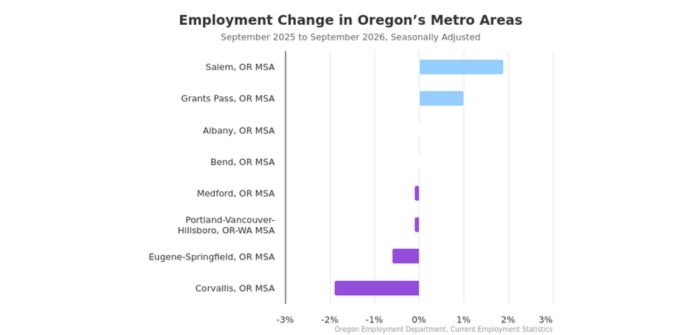
(Graphic courtesy of State of Oregon Employment Department)
Seasonally adjusted unemployment rates declined across Central Oregon in September.
Bend MSA (Crook, Deschutes, and Jefferson Counties): The Bend MSA’s seasonally adjusted unemployment rate was 4.8% in September, down from August’s rate of 4.9%. One year earlier, the rate stood at 5.1%.
The Bend MSA’s employment gains were marginally weaker than normal this September; total nonfarm employment was up by 560 jobs during the month (+0.5%), when an employment increase of 610 jobs would be expected. As a result, seasonally adjusted employment was down 50 jobs between August and September.
Private-sector employment fell by 870 jobs (-0.9%) over the month, with the largest declines concentrated in leisure and hospitality (-710 jobs) and trade, transportation, and utilities (-100 jobs). Smaller losses appeared in information (-60 jobs); private education and health services (-60 jobs); financial activities (-50 jobs); manufacturing (-50 jobs); mining, logging, and construction (-30 jobs); and other services (-20 jobs). Private-sector gains were concentrated in professional and business services (+210 jobs). Public-sector employment increased by 1,430 jobs, primarily driven by a seasonal increase in local government education (+1,460), with state government down 10 and federal government down 20 over the year.
Seasonally adjusted nonfarm employment in the Bend MSA has grown by 50 jobs over the year. While a decline of roughly 1,670 jobs was anticipated, total nonfarm employment instead fell by 1,620 jobs (-1.4%) on an unadjusted basis over the year, resulting in our seasonally adjusted number. The private sector experienced a net loss of 1,710 jobs (-1.7%), with the largest declines in professional and business services (-1,250 jobs), leisure and hospitality (-740 jobs), and trade, transportation, and utilities (-340 jobs) which experienced losses in all three subsectors. Smaller losses occurred in financial activities (-170 jobs) and information (-80 jobs). Private-sector gains were concentrated in private education and health services (+680 jobs); mining, logging, and construction (+80 jobs); other services (+60 jobs); and manufacturing (+50 jobs). Public-sector employment increased by 90 jobs, primarily driven by local government (+100 jobs), with state government up 40 and federal government down 50 over the year.
Crook County: Crook County’s seasonally adjusted unemployment rate went from 6.0% in August to 5.8% in September. The unemployment rate is now 0.2 percentage point lower than a year ago and a month ago.
Employment losses came in slightly larger than typical for September. Total nonfarm employment fell by 40 jobs (-0.6%), compared with an expected decrease of around 30 jobs. As a result, seasonally adjusted employment decreased by 10 jobs (-0.1%) from August to September.
Public-sector employment decreased by 10 jobs, all at the local level. Private-sector employment declined by 30 jobs, with losses occurring in construction (-30); leisure and hospitality (-20); professional and business services (-20 jobs); and information (-10 jobs). All other industries saw little to no change during the month.
Crook County’s seasonally adjusted nonfarm employment decreased by 250 jobs (-3.4%) over the past year; total nonfarm employment shed 260 jobs when a decline of 10 jobs was expected. Private-sector losses were concentrated in construction (-130 jobs); trade, transportation, and utilities (-50 jobs); and information (-50 jobs). Additional smaller losses occurred in professional and business services (-20 jobs), mining and logging (-20 jobs), and other services (-10 jobs). Private-sector gains were limited to private education and health services (+20 jobs); leisure and hospitality (+20); financial activities (+10 jobs); and manufacturing (+10 jobs). Public employment declined by 40 jobs year over year, with local government down 30 jobs and federal government down 10 jobs.
Deschutes County: Deschutes County’s seasonally adjusted unemployment rate declined 0.1 percentage point over the month and is now 4.7%. A year ago, the unemployment rate was 0.3 percentage point higher at 5.0%.
Employment gains were not as strong as expected in September. Total nonfarm employment rose by 530 jobs (+0.5%), opposite the usual August increase of about 540 jobs. As a result, seasonally adjusted employment decreased by 10 jobs between August and September.
The public sector was responsible for most of the month’s gains (+1,260 jobs), entirely driven by a 1,290-job seasonal increase in local government. Both state (-10 jobs) and federal government (-20 jobs) lost jobs over the month. On the private side, employment declined by 730 jobs, with leisure and hospitality posting the largest losses (-660 jobs), followed by private education and health services (-90 jobs) and trade, transportation, and utilities (-90 jobs). Smaller pullbacks occurred in information (-60 jobs), financial activities (-50 jobs), and manufacturing (-30 jobs). Offsetting gains were limited to professional and business services (+250 jobs).
Deschutes County lost 60 seasonally adjusted nonfarm jobs (-0.1%) over the year. Total nonfarm employment declined by 1,520 jobs (-1.5%) on an unadjusted basis, compared with an expected loss of roughly 1,460. Private-sector employment fell by 1,630 jobs (-1.9%), with the largest declines in professional and business services (-1,290 jobs); leisure and hospitality (-810 jobs); and trade, transportation, and utilities (-390 jobs). Additional losses occurred in financial activities (-200 jobs), information (-20 jobs), and manufacturing (-20 jobs). Gains were strongest in private education and health services (+700 jobs), with smaller increases in mining, logging, and construction (+280 jobs) and other services (+120 jobs). Public-sector employment rose by 110 jobs, mainly due to growth in local government (+160 jobs). State government added 30 jobs, while federal government lost 80.
Jefferson County: Jefferson County’s seasonally adjusted unemployment rate declined from 5.6% in August to 5.4% in September. The rate is now 0.6 percentage point lower than it was in September 2025, when it stood at 6.0%.
Employment growth fell short of expectations in September. Total nonfarm employment rose by 40 jobs (+0.6%), compared with the typical expectation of 80 jobs. As a result, seasonally adjusted employment decreased by 40 jobs in September.
All of the month’s gains came from the public sector (+190 jobs), originating entirely from local government. Total private employment was down 150 jobs with the largest losses seen in leisure and hospitality (-40 jobs) and manufacturing (-30 jobs). Additional but smaller losses were also seen in retail trade (-20 jobs); professional and business services (-20 jobs); private education and health services (-20 jobs); financial activities (-10 jobs); and other services (-10 jobs).
Over the year, Jefferson County added 80 seasonally adjusted nonfarm jobs (+1.2%). Manufacturing accounted for the bulk of the increase (+50 jobs). Smaller increases were seen in the public sector (+20 jobs), private education and health services (+20 jobs), and leisure and hospitality (+10 jobs). Losses were recorded in professional and business services, information, and mining and logging (each down 10 jobs).
Next Press Releases
The Oregon Employment Department plans to release the next statewide unemployment rate and employment survey data for October on Wednesday, November 18 and county and metropolitan area unemployment rates and employment survey data on Tuesday, November 24.
Bend MSA Current Labor Force and Industry Employment
–Change From-–
| September | August | September | August | September | |
|
Labor Force Status |
2026 | 2026 | 2025 | 2026 | 2025 |
| Civilian labor force | 136,409 | 137,086 | 136,172 | -677 | 237 |
| Unemployed | 5,484 | 6,432 | 6,624 | -948 | -1,140 |
| Unemployment rate | 4.0% | 4.7% | 4.9% | -0.7 | -0.9 |
| Unemployment rate (seasonally adjusted) | 4.8% | 4.9% | 5.1% | -0.1 | -0.3 |
| Employed | 130,925 | 130,654 | 129,548 | 271 | 1,377 |
|
Nonfarm Payroll Employment Total nonfarm employment |
111,240 |
110,680 |
112,860 |
560 |
-1,620 |
| Total nonfarm employment (seasonally adjusted) | 111,840 | 111,890 | 111,790 | -50 | 50 |
| Total private | 96,130 | 97,000 | 97,840 | -870 | -1,710 |
| Mining, logging, and construction | 9,530 | 9,560 | 9,450 | -30 | 80 |
| Manufacturing | 8,400 | 8,450 | 8,350 | -50 | 50 |
| Durable goods | 5,960 | 6,010 | 5,740 | -50 | 220 |
| Trade, transportation, and utilities | 18,420 | 18,520 | 18,760 | -100 | -340 |
| Wholesale trade | 2,830 | 2,840 | 2,980 | -10 | -150 |
| Retail trade | 12,950 | 13,060 | 13,070 | -110 | -120 |
| Transportation, warehousing, and utilities | 2,640 | 2,620 | 2,710 | 20 | -70 |
| Information | 1,930 | 1,990 | 2,010 | -60 | -80 |
| Financial activities | 5,490 | 5,540 | 5,660 | -50 | -170 |
| Professional and business services | 11,390 | 11,180 | 12,640 | 210 | -1,250 |
| Private education and health services | 20,280 | 20,340 | 19,600 | -60 | 680 |
| Leisure and hospitality | 16,460 | 17,170 | 17,200 | -710 | -740 |
| Accommodation and food services | 13,690 | 14,160 | 14,320 | -470 | -630 |
| Other services | 4,230 | 4,250 | 4,170 | -20 | 60 |
| Government | 15,110 | 13,680 | 15,020 | 1,430 | 90 |
| Federal government | 1,450 | 1,470 | 1,500 | -20 | -50 |
| State government | 1,730 | 1,740 | 1,690 | -10 | 40 |
| Local government | 11,930 | 10,470 | 11,830 | 1,460 | 100 |
| Local education | 6,390 | 4,930 | 6,310 | 1,460 | 80 |
The most recent month is preliminary, the prior month is revised. Prepared in cooperation with the U.S. Department of Labor, Bureau of Labor Statistics.
Civilian labor force includes employed and unemployed individuals 16 years and older by place of residence.
Employed includes payroll employment, self-employed, unpaid family workers, domestics, agriculture, and labor disputants. Unemployment rate is calculated by dividing unemployed by civilian labor force.
Nonfarm Payroll Employment: Official Oregon Series. Data are by place of work and cover full- and part-time employees who worked or received pay for the pay period that includes the 12th of the month. The data exclude the self-employed, volunteers, unpaid family workers, and domestics.
The Bend MSA includes Crook, Deschutes, and Jefferson counties.
Crook County Current Labor Force and Industry Employment
–Change From-–
| September | August | September | August | September | |
|
Labor Force Status |
2026 | 2026 | 2025 | 2026 | 2025 |
| Civilian labor force | 13,232 | 13,284 | 13,229 | -52 | 3 |
| Unemployed | 626 | 737 | 744 | -111 | -118 |
| Unemployment rate | 4.7% | 5.5% | 5.6% | -0.8 | -0.9 |
| Unemployment rate (seasonally adjusted) | 5.8% | 6.0% | 6.0% | -0.2 | -0.2 |
| Employed | 12,606 | 12,547 | 12,485 | 59 | 121 |
|
Nonfarm Payroll Employment Total nonfarm employment |
7,180 |
7,220 |
7,440 |
-40 |
-260 |
| Total nonfarm employment (seasonally adjusted) | 7,090 | 7,100 | 7,340 | -10 | -250 |
| Total private | 5,890 | 5,920 | 6,110 | -30 | -220 |
| Mining, logging, and construction | 860 | 890 | 1,010 | -30 | -150 |
| Mining and logging | 30 | 30 | 50 | 0 | -20 |
| Construction | 830 | 860 | 960 | -30 | -130 |
| Manufacturing | 620 | 620 | 610 | 0 | 10 |
| Wood product manufacturing | 220 | 220 | 230 | 0 | -10 |
| Trade, transportation, and utilities | 1,190 | 1,190 | 1,240 | 0 | -50 |
| Wholesale trade | 350 | 360 | 370 | -10 | -20 |
| Retail trade | 620 | 620 | 630 | 0 | -10 |
| Transportation, warehousing, and utilities | 220 | 210 | 240 | 10 | -20 |
| Information | 180 | 190 | 230 | -10 | -50 |
| Financial activities | 260 | 260 | 250 | 0 | 10 |
| Professional and business services | 630 | 650 | 650 | -20 | -20 |
| Private education and health services | 890 | 840 | 870 | 50 | 20 |
| Leisure and hospitality | 950 | 970 | 930 | -20 | 20 |
| Other services | 310 | 310 | 320 | 0 | -10 |
| Government | 1,290 | 1,300 | 1,330 | -10 | -40 |
| Federal government | 350 | 350 | 360 | 0 | -10 |
| State government | 140 | 140 | 140 | 0 | 0 |
| Local government | 800 | 810 | 830 | -10 | -30 |
The most recent month is preliminary, the prior month is revised. Prepared in cooperation with the U.S. Department of Labor, Bureau of Labor Statistics.
Civilian labor force includes employed and unemployed individuals 16 years and older by place of residence.
Employed includes payroll employment, self-employed, unpaid family workers, domestics, agriculture, and labor disputants. Unemployment rate is calculated by dividing unemployed by civilian labor force.
Nonfarm Payroll Employment: Data are by place of work and cover full- and part-time employees who worked or received pay for the pay period that includes the 12th of the month. The data exclude the self-employed, volunteers, unpaid family workers, and domestics.
Deschutes County Current Labor Force and Industry Employment
–Change From-–
| September | August | September | August | September | |
|
Labor Force Status |
2026 | 2026 | 2025 | 2026 | 2025 |
| Civilian labor force | 111,956 | 112,450 | 111,694 | -494 | 262 |
| Unemployed | 4,373 | 5,068 | 5,253 | -695 | -880 |
| Unemployment rate | 3.9% | 4.5% | 4.7% | -0.6 | -0.8 |
| Unemployment rate (seasonally adjusted) | 4.7% | 4.8% | 5.0% | -0.1 | -0.3 |
| Employed | 107,583 | 107,382 | 106,441 | 201 | 1,142 |
|
Nonfarm Payroll Employment Total nonfarm employment |
97,150 |
96,620 |
98,670 |
530 |
-1,520 |
| Total nonfarm employment (seasonally adjusted) | 97,670 | 97,680 | 97,730 | -10 | -60 |
| Total private | 85,710 | 86,440 | 87,340 | -730 | -1,630 |
| Mining, logging, and construction | 8,500 | 8,500 | 8,220 | 0 | 280 |
| Manufacturing | 6,600 | 6,630 | 6,620 | -30 | -20 |
| Durable goods | 4,430 | 4,460 | 4,280 | -30 | 150 |
| Trade, transportation, and utilities | 16,180 | 16,270 | 16,570 | -90 | -390 |
| Wholesale trade | 2,290 | 2,300 | 2,460 | -10 | -170 |
| Retail trade | 11,540 | 11,640 | 11,750 | -100 | -210 |
| Transportation, warehousing, and utilities | 2,350 | 2,330 | 2,360 | 20 | -10 |
| Information | 1,720 | 1,780 | 1,740 | -60 | -20 |
| Financial activities | 5,080 | 5,130 | 5,280 | -50 | -200 |
| Professional and business services | 10,460 | 10,210 | 11,750 | 250 | -1,290 |
| Private education and health services | 18,650 | 18,740 | 17,950 | -90 | 700 |
| Leisure and hospitality | 14,750 | 15,410 | 15,560 | -660 | -810 |
| Accommodation and food services | 12,090 | 12,520 | 12,790 | -430 | -700 |
| Other services | 3,770 | 3,770 | 3,650 | 0 | 120 |
| Government | 11,440 | 10,180 | 11,330 | 1,260 | 110 |
| Federal government | 960 | 980 | 1,040 | -20 | -80 |
| State government | 1,190 | 1,200 | 1,160 | -10 | 30 |
| Local government | 9,290 | 8,000 | 9,130 | 1,290 | 160 |
| Local education | 5,380 | 4,110 | 5,270 | 1,270 | 110 |
The most recent month is preliminary, the prior month is revised. Prepared in cooperation with the U.S. Department of Labor, Bureau of Labor Statistics.
Civilian labor force includes employed and unemployed individuals 16 years and older by place of residence.
Employed includes payroll employment, self-employed, unpaid family workers, domestics, agriculture, and labor disputants. Unemployment rate is calculated by dividing unemployed by civilian labor force.
Nonfarm Payroll Employment: Data are by place of work and cover full- and part-time employees who worked or received pay for the pay period that includes the 12th of the month. The data exclude the self-employed, volunteers, unpaid family workers, and domestics.
Jefferson County Current Labor Force and Industry Employment
–Change From-–
| September | August | September | August | September | |
|
Labor Force Status |
2026 | 2026 | 2025 | 2026 | 2025 |
| Civilian labor force | 11,221 | 11,352 | 11,249 | -131 | -28 |
| Unemployed | 485 | 627 | 627 | -142 | -142 |
| Unemployment rate | 4.3% | 5.5% | 5.6% | -1.2 | -1.3 |
| Unemployment rate (seasonally adjusted) | 5.4% | 5.6% | 6.0% | -0.2 | -0.6 |
| Employed | 10,736 | 10,725 | 10,622 | 11 | 114 |
|
Nonfarm Payroll Employment Total nonfarm employment |
6,820 |
6,780 |
6,750 |
40 |
70 |
| Total nonfarm employment (seasonally adjusted) | 6,760 | 6,800 | 6,680 | -40 | 80 |
| Total private | 4,440 | 4,590 | 4,390 | -150 | 50 |
| Mining, logging, and construction | 210 | 210 | 220 | 0 | -10 |
| Mining and logging | 10 | 10 | 20 | 0 | -10 |
| Construction | 200 | 200 | 200 | 0 | 0 |
| Manufacturing | 1,170 | 1,200 | 1,120 | -30 | 50 |
| Wood product manufacturing | 900 | 910 | 840 | -10 | 60 |
| Trade, transportation, and utilities | 950 | 970 | 950 | -20 | 0 |
| Wholesale trade | 160 | 160 | 150 | 0 | 10 |
| Retail trade | 680 | 700 | 690 | -20 | -10 |
| Transportation, warehousing, and utilities | 110 | 110 | 110 | 0 | 0 |
| Information | 30 | 30 | 40 | 0 | -10 |
| Financial activities | 130 | 140 | 130 | -10 | 0 |
| Professional and business services | 230 | 250 | 240 | -20 | -10 |
| Private education and health services | 800 | 820 | 780 | -20 | 20 |
| Leisure and hospitality | 720 | 760 | 710 | -40 | 10 |
| Other services | 200 | 210 | 200 | -10 | 0 |
| Government | 2,380 | 2,190 | 2,360 | 190 | 20 |
| Federal government | 90 | 90 | 100 | 0 | -10 |
| State government | 410 | 410 | 390 | 0 | 20 |
| Local government | 1,880 | 1,690 | 1,870 | 190 | 10 |
| Indian tribal | 900 | 910 | 850 | -10 | 50 |
The most recent month is preliminary, the prior month is revised. Prepared in cooperation with the U.S. Department of Labor, Bureau of Labor Statistics.
Civilian labor force includes employed and unemployed individuals 16 years and older by place of residence.
Employed includes payroll employment, self-employed, unpaid family workers, domestics, agriculture, and labor disputants. Unemployment rate is calculated by dividing unemployed by civilian labor force.
Nonfarm Payroll Employment: Data are by place of work and cover full- and part-time employees who worked or received pay for the pay period that includes the 12th of the month. The data exclude the self-employed, volunteers, unpaid family workers, and domestics.
The Oregon Employment Department and the U.S. Bureau of Labor Statistics (BLS) work cooperatively to develop and publish monthly payroll employment and labor force data for Oregon’s metropolitan areas and counties. The estimates of monthly job gains and losses are based on a survey of businesses. The estimates of unemployment are based on a survey of households and other sources.
The Oregon Employment Department payroll employment estimates are revised quarterly using information from unemployment insurance tax records. All department publications use data from this official Oregon series unless noted.
The department also makes the BLS-produced nonfarm payroll employment series for metropolitan areas available. These are revised annually by BLS.