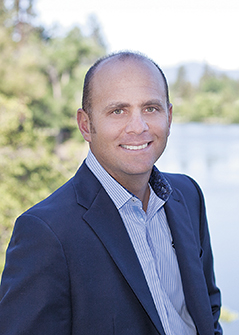
(Photo above: David Rosell)
When I ask investors how the stock markets performed in 2014, most respond that it did very well. In reality the results were rather disappointing at best as 10 of the key 26 asset classes were in negative territory and another 8 performed under 2 percent for the year.¹ How could there be such a difference between perception and reality? I believe the main reason for this investor incongruity is due to the very narrow focus of how the media reports the markets.
Watch the news on television, listen to it on the radio or read the newspaper and most of the time they focus on just the S&P 500 and the Dow Jones Industrial Average (DJIA). Both of these indexes represent just one asset class: US Large Cap Growth. What about the numerous other asset classes that investors should own in a well diversified portfolio?
In 2014, if an investor would have put 100% of his or her money only in the S&P 500 index, it would have been a hugely successful speculation as it was one of the few big performers for 2014 experiencing a 13.69% return. However, doing the same in 2005-2007 or 2009 would have been a disaster.²
If you have a question about the volatility of year-to-year leadership in the investment return derby, I refer you to the popular Callan Chart. It shows the ranking of the major asset classes over each of the past 10 years. If only we could see the 2015 version today!
Unfortunately, investing is not doable in hindsight and thus opportunities for hugely successful results also carry the risk of disaster. Another extremely successful speculation for 2014 would have been to hugely increase the maturity of bond holdings. However, if interest rates would have risen instead of falling in 2014, a portfolio of long term bonds would have been massacred. A 1 percent rise in rates could have caused losses of 10-25 percent in value – that is just too risky.³
While diversified portfolios typically fare well versus benchmarks of the S&P 500 or DJIA, globally diversified portfolios struggled versus the S&P 500 and DJIA over the past year.
When selecting an investment portfolio, it is important to consider several factors. Instinctively many look first to past performance, regardless of the fact that historical returns may not be indicative of the future outcomes. Regardless, if this is the first factor one analyzes, it would be prudent to consider the underlying risk taken in order to achieve those returns as a next step. This is often referred to as the “risk weighted return” and is a way of measuring and comparing different investments based not just on the returns achieved but also the risk associated with that particular investment.
The performance of a properly diversified portfolio will simply be the weighted average performance of the individual components. In any given year, the diversified portfolio will never outperform the best performing asset class or underperform the worst performing asset class; rather performance will be somewhere in between. Furthermore, no one is capable of consistently predicting which investments will outperform or underperform each year. Therefore, utilizing a diversified portfolio strategy attempts to integrate different assets classes and how they interact with one another to increase overall risk weighted returns.
Examining each asset classes’ unique risk weighted return vs. a diversified portfolio’s risk weighted return is a key way of measuring how diversification could help to seek maximum returns for a specified unit of risk. The chart below shows the average return and standard deviation (a measure of risk) of some essential asset classes from 2003–14. In order to evaluate which portfolio has a higher risk weighted return investment managers often use a statistical measurement known as the Sharpe Ratio.
The Sharpe Ratio allows us to compare different investments based on returns achieved and the risk accepted to achieve such returns. The portfolio with the highest Sharpe Ratio is said to have the greatest risk weighted return. A generally accepted risk free rate of return is the 90 day Treasury Bill which from 2003–2014 averaged 1.93 percent.
At first glance Real Estate or Small Cap may look most appealing with very handsome returns and yet the risk they accepted to achieve such returns, measured by Standard Deviation, are significant. The diversified portfolio illustrates healthy returns, an acceptable amount of risk and the greatest risk weighted return. Diversify in 2015!
See chart below illustrates how these various asset classes perform on a risk weighted return basis.
| US Gov. Bonds | US Corp. Bonds |
Mid Cap |
Real Estate |
Foreign |
Small Cap |
Large Cap |
Diversified 70/30 Portfolio* | |
| Average Return | 5.3% | 5.9% | 9.9% | 11.1% | 8.2% | 12.3% | 9.6% | 9.6% |
| Standard Deviation | 6.4% | 4.5% | 18.5% | 22.6% | 21.3% | 18.8% | 17.2% | 11.2% |
| Sharpe
Ratio |
0.61 | 1.02 | 0.46 | 0.43 | 0.32 | 0.58 | .48% | .74% |
Source iShares
* 70/30 portfolio is comprised of 25% S&P 500, 20% Small Cap, 15% MSCI EAFE, 10% REITS, 30% US Corporate Bonds
David Rosell is President of Rosell Wealth Management in Bend. He is the author of Failure is Not an Option- Creating Certainty in the Uncertainty of Retirement. You may learn more about his book at www.DavidRosell.com or Amazon.com. Ask for David’s book at Barnes & Noble and in Bend at Newport Market, Cafe Sintra, Bluebird Coffee Shop and Powell’s Books in Portland.
¹ Bloomberg News
² Callan Chart from iShares
³ Michael McClary. Chief Financial Officer, ValMark Securities, Inc.
Investment advisory services offered through Rosell Wealth Management, a State Registered Investment Advisor. Securities offered through ValMark Securities, Inc. Member FINRA, SIPC 130 Springside Drive, Ste 300 Akron, Ohio 44333-2431. 800 765-5201. Rosell Wealth Management is a separate entity from ValMark Securities.


