

(Maps courtesy of Compass Commercial Real Estate Services)
Is Central Oregon Ready?
Across the country, billions of dollars in commercial real estate loans are scheduled to mature between 2026 and 2028. Many of these loans originated during a period of historically low interest rates, when borrowing costs often ranged between 3% and 4%. Today, owners seeking to refinance are facing a much different environment, with rates that can be two to three percentage points higher.
For many property owners, that difference in borrowing costs can significantly impact monthly cash flow and overall property performance. That shift is causing many to ask the same important question: Should I refinance, hold, or sell?
Fortunately, Central Oregon isn’t San Francisco, Portland, or Chicago.
One of the reasons our market has remained resilient is because the fundamentals are still strong. Bend and Redmond continue to attract businesses and residents, industrial space remains in high demand, and office vacancy, although trending upwards, has held up much better than many larger markets.
However, that doesn’t mean we’re completely insulated from what’s happening nationally.
Imagine purchasing a property in 2021 with a loan at 3.5%. Today, that same loan could refinance at 6% or more. Even if your property continues to perform well, a meaningful increase in monthly debt payments can greatly impact both cash flow and long-term investment returns.
For some owners, refinancing will be a non-event. Many Central Oregon property owners have held assets for years and have built substantial equity. But for others, particularly those who purchased at peak pricing, the next few years could present some difficult decisions.
Many multifamily properties and highly leveraged acquisitions from 2021-2022 are the asset types worth watching most closely. That’s not to say we’ll see widespread distress, but you will see more owners evaluating whether it makes sense to recapitalize, refinance, or bring properties to market.
The good news? Market shifts often create opportunities.
Buyers who have been waiting on the sidelines may finally begin to see a welcome increase in available inventory. Seller financing could also become more common. Transaction activity may pick up as property owners carefully reassess their long-term plans and investment goals.
Central Oregon will likely continue to outperform many parts of the country over the next several years. That being said, we’re entering a period where understanding debt and capital markets will become just as important as understanding lease rates and vacancy.
If you’re a property owner with a loan maturing in the next 12 to 24 months, now is the time to start having conversations with your lender, broker, and financial advisor—not six months before maturity.
The national refinancing wave is already underway. It will be interesting to see how Central Oregon responds.
Bend Office
by Jay Lyons, SIOR, CCIM, Partner & Broker — Compass Commercial Real Estate Services
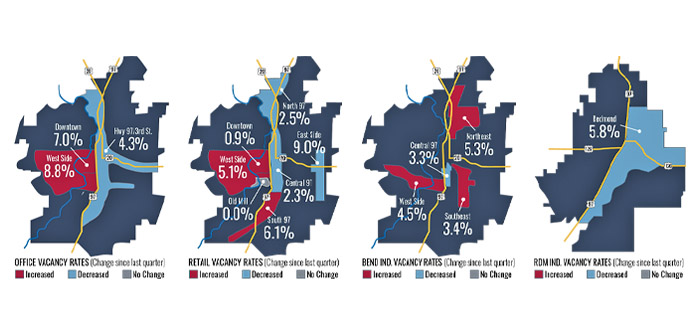
Compass Commercial surveyed 225 office buildings totaling 2.79 million square feet for the Q2 2026 report. In Q2, the market experienced negative absorption of 8,928 SF. Including this latest quarter, the Bend office market has recorded negative absorption in six of the past seven quarters. The vacancy rate increased to 7.38% in Q2 2026, up from 7.05% in Q1 2026 and 6.28% in Q2 2025. A potential silver lining is that available sublease space decreased from 50,524 SF in Q1 to 36,789 SF in Q2, resulting in an overall availability rate of 8.69% in Q2 2026, compared to 8.75% in Q1 2026.
LEASING: Leasing activity remains slow, with sporadic activity across all office market segments. The Hwy 97/Third St. submarket experienced modest positive absorption of 2,058 SF. The Downtown and West Side submarkets experienced negative absorption of 3,292 SF and 7,694 SF, respectively.
RENTS: Lease rates remain flat, with the high end of the market ranging from $2.00 to $3.15/SF/Mo. NNN and more affordable space ranging from $1.40 to $2.00/SF/Mo. NNN.
CONSTRUCTION: No speculative office buildings are currently under construction in Bend.
SALES: Office sales activity was limited but included two notable transactions during the quarter. An 11,178 SF multi-tenant medical office building at 2698 NE Courtney Drive sold in May for $3,700,000, or $331/SF, to an owner-user. A 12,395 SF office building located at 300 SW Columbia Street sold in June for $4,300,000, or $343/SF. The building was 100% leased at the time of sale but was purchased by an owner-user who plans to eventually occupy a portion of the property.
Bend Retail
by Russell Huntamer, CCIM, President, Partner & Broker — Compass Commercial Real Estate Services
Compass Commercial surveyed more than 4.61 million square feet of retail space across 275 Bend buildings for the Q2 2026 report. Overall vacancy decreased from 4.37% in Q1 to 3.95% in Q2, driven by 19,333 SF of positive net absorption. Year-to-date positive net absorption reached 16,785 SF.
LEASING: The Central submarket led the quarter with 27,597 SF of positive absorption, reducing vacancy from 6.29% to 2.29%. Vacancy also declined on the East Side from 9.35% to 8.96% and in the North Hwy 97 submarket from 2.77% to 2.52%, while the Old Mill District remained at 0%. Increases occurred on the West Side, where vacancy rose from 4.51% to 5.11% following 3,605 SF of negative absorption; in South Hwy 97, from 5.22% to 6.09%; and Downtown, from 0.34% to 0.92%.
RENTS: Asking rates for inline and second-generation retail space range from about $17.00 to $45.00/SF/Yr. NNN. Value and second-generation space along the NE 1st Street and 3rd Street corridors is being marketed in the $17.00 to $19.00/SF/Yr. range, while premium and newly constructed inline space is asking $40.00 to $45.00/SF/Yr. Drive-thru and pad sites continue to command the top of the market, with the drive-thru pad at Cleveland Square listed at $60.00/SF/Yr. NNN and comparable pad sites ranging up to roughly $65.00/SF/Yr.
CONSTRUCTION: Leasing and construction remained active at Bend’s newest mixed-use and pad developments. At Killian Pacific’s Jackstraw, Way West bar is open, MMA Nails is under construction, and Peak Credit has signed a lease. All C-suites are pending, leaving one available A-building suite. The North End development will deliver a drive-thru and walk-up retail building occupied by Axel’s Taco Shop and Wingstop, respectively.
SALES: At 612 SE 3rd Street, a 2,268 SF single-tenant Burgerville building sold in May for $3,000,000, or $1,322/SF. The 2,370 SF Super Deluxe Burgers building at 805 NE 3rd Street sold in April for $1,975,000, or $833/SF. The 991 SF former Creative Hair Graphics building at 1040 NW Galveston Avenue sold in May for $1,050,000, or $1,059/SF, while the 1,880 SF building at 1244 NW Galveston Avenue sold in June to an owner-user for $666,290, or $354/SF.
Bend Industrial
by Graham Dent, SIOR, Partner & Broker — Compass Commercial Real Estate Services
Compass Commercial surveyed 336 industrial buildings in Bend totaling 4.87 million square feet for the Q2 2026 report. The market experienced 10,436 SF of positive absorption during the quarter, resulting in an overall vacancy rate of 4.38%. Bend currently has 213,647 SF of industrial space available, reflecting continued tight market conditions and steady demand across the market.
LEASING: The industrial market experienced modest leasing activity during this second quarter, with the Northeast and Central submarkets recording 23,366 and 23,863 square feet of positive absorption, respectively.
RENTS: The average asking lease rate for raw industrial space increased marginally from $1.13/SF/Mo. at the end of Q1 to $1.14/SF/Mo. at the end of Q2. State-of-the-art industrial buildings are commanding rents between $1.65 and $1.85/SF/Mo. NNN, while second-generation industrial/flex spaces are leasing in the $1.50 to $1.65/SF/Mo. NNN range.
CONSTRUCTION: Taylor Brooks completed construction of NOCO at Juniper Ridge during the quarter. This first phase, located at the northwest corner of Cooley Road and NE 18th Street, consists of three industrial/flex buildings totaling 62,429 SF, adding much-needed modern inventory and flexible space options to Bend’s growing industrial market.
SALES: One notable sale occurred during Q2 2026. The Columbia Distribution building, located at 20735 High Desert Lane, sold off-market for $18,700,000, or $175/SF in May. The buyer is an entity associated with the tenant, Columbia Distributing.
Redmond Industrial
by Kristie Schmitt, CCIM, Broker — Compass Commercial Real Estate Services
Compass Commercial surveyed 99 industrial buildings in Redmond totaling approximately 1.86 million square feet for the Q2 2026 report. Following two consecutive quarters of negative absorption, the market recorded positive absorption, decreasing vacancy from 7.26% to 5.84%.
LEASING: Leasing activity remained steady in Q2, with several larger spaces executing leases and contributing to the decline in vacancy. Increased touring activity suggests underlying demand remains intact, particularly among small- to mid-sized users.
RENTS: Industrial asking rents in Q2 2026 ranged from approximately $0.85/SF/Mo. NNN on the lower end to $1.20/SF/Mo. NNN for specialty-use or first-generation space. While the upper end remained stable, some landlords reduced their marketed lease rates.
CONSTRUCTION: Construction is underway on an approximately 47,000 SF speculative industrial building at 2020 SW Deerhound Avenue, with completion anticipated in fall 2026.
SALES: Several notable sales closed in Q2 2026. Redmond Industrial Park, located at 601 E Antler Avenue, is a 44.61-acre, 198,000 SF industrial property that sold for $21,000,000, or $106/SF, to a joint venture, yielding a 9.54% cap rate. The 15.69-acre property at 85 E Highway 126, which includes a 13,950 SF warehouse, sold to an investor for $1,390,000, or $99/SF. The 0.19-acre property at 407 SW Warsaw Avenue, improved with a 2,485 SF warehouse, sold for $760,000, or $306/SF, to an owner-user.