

KEY HIGHLIGHTS
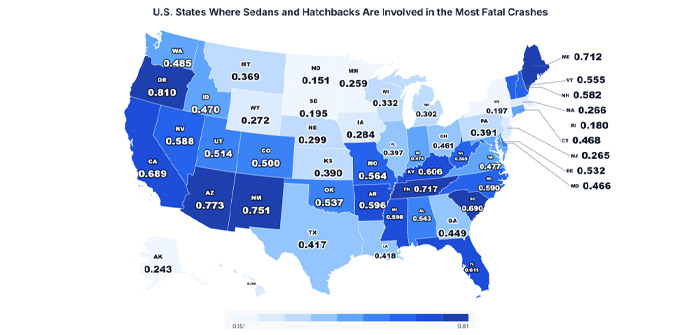
- Oregon leads all 50 states with an average annual fatal sedan and hatchback crash rate of 0.81 per 100,000 residents, over 5 times higher than North Dakota at 0.15, the lowest rate in the country.
- Oregon recorded 173 total fatal sedan and hatchback crashes over the five-year study period from 2020 to 2024, with the highest single-year count of 45 crashes occurring in 2023.
- Oregon’s fatal sedan and hatchback crash count rose 65.2% between 2020 and 2024, ranking the state 9th nationally for the sharpest increase over the five years studied.
For a long time, Oregon has defined itself by its open highways, winding coastal routes, and a mix of urban and rural driving conditions that challenge everyday passenger vehicles. Yet behind the scenic character of the state’s roads lies a troubling pattern: Oregon records the highest per capita rate of fatal sedan and hatchback crashes of any state in the country.
According to Grigor Law Injury and Car Accident Lawyers, the data came from the CDAN (Crash Data Analysis Network) database maintained by the U.S. Department of Transportation and covers all 50 states for 2020 through 2024. The study examines fatal crashes involving sedan and hatchback body types, ranking states by their average annual crash count per 100,000 residents, based on 2024 Census population estimates.
Oregon Leads All States With the Highest Fatal Sedan and Hatchback Crash Rate per 100,000 Residents
| State | Average Annual Fatal Crashes (2020-2024) | Rate per 100,000 Residents | Rank |
| Oregon | 34.6 | 0.81 | 1 |
| Arizona | 58.6 | 0.77 | 2 |
| New Mexico | 16.0 | 0.75 | 3 |
| Tennessee | 51.8 | 0.72 | 4 |
| Maine | 10.0 | 0.71 | 5 |
| South Carolina | 37.8 | 0.69 | 6 |
| California | 271.8 | 0.69 | 7 |
| Florida | 142.8 | 0.61 | 8 |
| Kentucky | 27.8 | 0.61 | 9 |
| Mississippi | 17.6 | 0.60 | 10 |
Oregon ranks first in the nation with an average annual fatal sedan and hatchback crash rate of 0.81 per 100,000 residents, placing it ahead of Arizona (0.77) and New Mexico (0.75), the next two highest-ranked states. Oregon’s average of 34.6 fatal crashes per year over the study period is notably high given the state’s population of just over 4.27 million, underscoring that the risk is concentrated on a per capita basis rather than driven by sheer population volume. Nine of the ten states with the highest per capita rates are in the South or West, and Oregon’s position at the top of this list points to a distinct set of road conditions and driving patterns that separate it from states with far larger populations and lower rates.
Looking at the study, Chrissy Grigoropoulos, founder of Grigor Law Injury & Car Accident Lawyers, commented:
“Oregon’s position at the top of this national ranking is a significant signal for drivers, policymakers, and road safety advocates in the state. A sedan or hatchback driver in Oregon faces a per-capita fatal crash rate that exceeds every other state in the country, which speaks to the need for targeted intervention at the local level. For injury victims, understanding that Oregon carries the nation’s highest rate adds important context when evaluating road safety accountability and the circumstances behind individual crashes.”
Oregon’s Fatal Sedan and Hatchback Crashes Rose 95.7% From 2020 to Their 2023 Peak Before Partially Recovering
| Year | Fatal Sedan and Hatchback Crashes in Oregon | Change From Prior Year |
| 2020 | 23 | Baseline |
| 2021 | 34 | +47.8% (+11) |
| 2022 | 33 | -2.9% (-1) |
| 2023 | 45 | +36.4% (+12) |
| 2024 | 38 | -15.6% (-7) |
Oregon’s fatal sedan and hatchback crash count jumped sharply from 23 in 2020 to 34 in 2021, a single-year rise of 47.8%, nearly double the national increase of 24.0% recorded over the same period. After a marginal dip to 33 in 2022, crashes climbed again to a five-year peak of 45 in 2023, representing a 95.7% increase from the 2020 baseline. The 2024 figure of 38 shows a 15.6% decline from the 2023 peak, offering a partial recovery, though it remains 65.2% above the 2020 starting point. Oregon’s five-year total of 173 fatal crashes averages 34.6 per year, confirming that the state’s elevated crash rate has been a persistent pattern across each of the five years studied.
Methodology
The primary data source is the CDAN (Crash Data Analysis Network) database, maintained by the U.S. Department of Transportation and accessible at https://cdan.dot.gov/query. The study covers all 50 U.S. states for the five years from 2020 through 2024 and examines fatal crashes involving sedan and hatchback body types as recorded in the CDAN database. States were ranked by their average annual number of fatal crashes per 100,000 residents to enable a population-adjusted comparison across states of varying sizes. Population figures are based on 2024 U.S. Census Bureau estimates. The counts of crashes reflect involvement in fatal incidents and are not limited to at-fault parties.
Data Sources
- CDAN (Crash Data Analysis Network), U.S. Department of Transportation: https://cdan.dot.gov/query
- Research Dataset: https://docs.google.com/spreadsheets/d/1C1h5TU1jq_L_8MV5IzB-r0UYbo4CrU8usVDwOrtWs-U/edit?gid=0#gid=0
- Research by: https://grigorlaw.com/
About Grigor Law Injury & Car Accident Lawyers
Grigor Law Injury & Car Accident Lawyers is a premier New York “all injury” law firm representing clients in personal injury, car accidents, workers’ compensation, and no-fault claims.