(Graphics | Courtesy of Compass Commercial Real Estate Services)
Central Oregon is one of the country’s most desirable places for relocating. The demand for real estate, the significant increase of in-migration and the constraints of city barriers have created challenges in redirecting roadways. These challenges have prompted government entities to use Eminent Domain practices to reroute streets.
DEVELOPMENT & GROWTH
Residential inventory is extremely low, which consequentially, places home prices at an all-time high. Commercial real estate is seeing similar trends in supply and demand.
Oregon’s commercial and residential development regulations are unique in that all development must be within the “artificial ring” boundary around each city. The Deschutes River, Hwy. 97 and the BNSF Railroad in Bend act as barriers causing significant limitations on the development of roadways. Similar limitations affect streets in other parts of the region as well.
Central Oregon municipalities are experiencing several situations where they need help with building badly needed roads. The Oregon Department of Transportation (ODOT) negotiates with property owners over land-use needs for these roads. This negotiation could be as small as needing a few feet of land to widen streets or needing several acres of land and demolishing existing buildings to reroute streets.
Notably, ODOT intends to reroute Hwy. 97 in the north end of Bend. This new route will start at Empire Boulevard, turn east to parallel the railroad tracks and reconnect just north of Cooley Road. Land-acquisition circumstances like this one may mean the end of your business if you can’t relocate.
THIS IS WHERE EMINENT DOMAIN COMES INTO PLAY
Eminent Domain becomes the legal pathway for governmental agencies to acquire the land they need to build these necessary roads. This process of taking can be complicated. But, you do have rights as a property owner.
The acquiring agency often has its own in-house appraisers, as is the case with ODOT. They will produce an appraisal and submit an offer to you. The taking entity may have several buckets of funds, and it is critical to understand how you can benefit from each one.
Remember, this is a negotiation. Because you would receive an offer for your land and buildings, you need to hire the right professionals to represent you.
HIRING THE RIGHT PROFESSIONALS
Depending on how complicated your property is, it may take five or six professionals to get you the appropriate valuation for your property. This team may consist of an experienced Eminent Domain attorney, an Eminent Domain appraiser, a building contractor, a CPA, a 1031/1033 tax deferral accommodator and a commercial real estate broker.
Without professional guidance, you could miss out on potential tax write-offs or make an uninformed decision. If you find yourself in this situation, contact one of our experienced commercial real estate brokers to help guide you.
compasscommercial.com
Bend OFFICE Market
DOWN 6.66 percent Vacancy
UP 29,554 sq. ft. Absorption
Compass Commercial surveyed 218 office buildings totaling over 2.72 million square feet for the first quarter office report of 2021. 29,554 sq. ft. was leased during the quarter and the vacancy rate dropped from 7.41 percent in Q4 ‘20 to 6.66 percent in Q1 ‘21. There is now 180,950 sq. ft. available for lease down from 202,417 sq. ft. in Q4.
All three submarkets recorded positive absorption in the period, a hopeful sign of improving conditions.
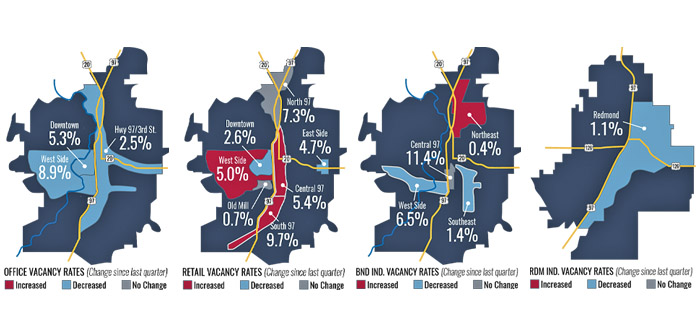
Downtown: This submarket leased 1,537 SF, lowering the vacancy rate from 5.70 percent in Q4 to 5.28 percent in the first quarter. Three buildings recorded a decrease in occupancy and three increased occupancy in the quarter. There is currently 24,936 sq. ft. of available office space in the downtown area compared to 27,954 sq. ft. in Q4.
Hwy. 97/3rd St: 11,332 sq. ft. was leased in this submarket with eight buildings adding occupancy and three losing occupancy. The vacancy rate fell from 4.16 percent to 2.53 percent as a result.
West Side: This submarket recorded positive net absorption of 16,685 sq. ft. and the vacancy rate fell from 9.37 percent to 8.86 percent. Fourteen buildings reported positive net absorption and four reported available square footage. Currently there is 138,895 sq. ft. of leasable space on the west side, down from 146,012 sq. ft. in Q4.
Bend RETAIL Market
UP 5.98 percent Vacancy
DOWN -943 sq. ft. Absorption
Compass Commercial surveyed 259 retail buildings totaling over 4.51 million square feet for the first quarter of 2021. The citywide vacancy rate rose slightly for the fifth quarter in a row from 5.81 percent at the end of Q4 ‘20 to 5.98 percent at the end of Q1 ’21. An increase of 943 sq. ft. of vacancy was recorded. Two of the seven retail submarkets recorded a decrease in occupancy, three showed an increase and two remained the same during the quarter. 269,346 sq. ft. of retail space is now available city-wide, up from 261,827 sq. ft. in Q4.
South 97: 2,875 sq. ft. of leasable space became available in Q1. Two buildings lost occupancy and two gained in Q1, and the submarket finished at 9.74 percent vacancy, up from 9.27 percent in the previous quarter. The largest vacancy of 11,480 sq. ft. took place when Xcel Fitness closed its doors at Reed Lane Plaza.
Central 97: This submarket also saw 6,503 sq. ft. become available with two new vacancies and two new leases signed in Q4. As a result, the vacancy rate moved from 4.37 percent in Q4 to 5.35 percent in Q1.
North 97: This submarket was unchanged in the quarter and remains at 7.26 percent vacancy with 87,120 sq. ft. available.
East Side: This submarket leased 1,140 sq. ft. of space in Q1, lowering the vacancy rate from 4.91 percent in Q4 to 4.71 percent in Q1. One building gained occupancy and one lost occupancy. There is now 27,238 sq. ft. available.
West Side: 3,820 sq. ft. was leased in the quarter, but the vacancy rate rose to 4.93 percent from 4.47 percent in Q4 due to the addition of the new Grove retail center in NW Crossing, adding 6,576 sq. ft. to the survey. Two buildings showed an increase in occupancy on the west side with 26,877 sq. ft. now available, up from 24,121 sq. ft. in Q4.
Old Mill District: This submarket remained unchanged in Q1 with 1,940 sq. ft. available and a 0.73 percent vacancy rate.
Downtown: 3,475 sq. ft. was leased in the quarter. Currently, there is 11,161 sq. ft. available, down from 14,636 sq. ft. in Q4. Two buildings recorded positive absorption and two were negative. The vacancy rate is now 2.57 percent, down from 3.37 percent.
INDUSTRIAL Market Bend
DOWN 2.27 percent Vacancy
UP 40,415 sq. ft. Absorption
Compass Commercial surveyed 319 buildings for the first quarter of 2021 industrial report totaling 4.60 million square feet. The industrial market leased 40,415 sq. ft. of industrial space in Q1 and the vacancy rate fell from 2.35 percent in Q4 ‘20 to 2.27 percent in Q1 ‘21. There is now just 104,035 sq. ft. of industrial space available for lease in Bend, compared to 108,105 sq. ft. in Q4. This represents under an eight months’ supply at current leasing absorption rates.
Two submarkets recorded positive net absorption in Q1 ‘21, one gained available space and one remained the same.
Southeast: This submarket recorded 35,601 sq. ft. of positive net absorption and the vacancy rate is now just 1.37 percent, down from 3.49 percent in Q4. Nine buildings added occupancy and two added a vacancy in the quarter in the 143-building submarket. There is now 23,167 sq. ft. available for lease, compared with 58,768 sq. ft. in Q4.
Northeast: 2,118 sq. ft. of available space was recorded with just one building losing occupancy at the Deschutes Business Center. The vacancy rate now stands at 0.36 percent, up from 0.26 percent in Q4 with just 7,618 sq. ft. available in the 2.1 million sq. ft. submarket.
Central: This submarket saw no change in absorption in Q1. However, the vacancy rate is now at 11.40 percent, due to a correction from Q4’s survey with 53,591 sq. ft. available in the 38-building central submarket.
West Side: This submarket leased 6,932 sq. ft. at The Quad at Skyline Ridge in Q1. This resulted in a 6.49 percent vacancy rate, down from 9.73 percent in the fourth quarter of 2020. There is now 19,659 sq. ft. of leasable space in the 303,106 sq. ft. submarket.
REDMOND
DOWN 1.14 percent Vacancy
UP 52,075 sq. ft. Absorption
Of the 88 buildings surveyed, an impressive 52,075 square feet was leased in the first quarter of 2021. The vacancy rate fell precipitously as a result from 4.27 percent to just 1.14 percent. This represents the second lowest vacancy rate since we began surveying the Redmond industrial market in 1995. The lowest rate was at 0.63 percent in Q3 2000 with less than 400,000 sq. ft. on the entire market, compared with today’s 1,663,927 sq. ft. of total leasable space. There is now only 19,000 sq. ft. available, representing a one-month supply at current lease-up levels. Six buildings gained occupancy and one lost occupancy in Q1.


