


Central Oregon has experienced unprecedented growth across the construction spectrum in the last few years. Construction companies, architects and engineers have backlogs, in some cases amounting to years. Material prices and availability are following the same trend, and production and delivery wait times are increasing. Skilled workers are increasingly more difficult to find and retain. As we attempt to meet expectations and deliver projects, the competition for dependable workers is aggressive, wages are rising, the expectations of benefits are increasing, and the lingering effects of the COVID pandemic remain.
While most of the construction industry was considered essential through the pandemic, the process of the day-to-day work effort changed. Production fell as companies tried to sort through the ways to protect their workers, comply with the ever-changing regulations and still get the work done. Two years later, people are still working from home, and staffing has not recovered. We had never faced something like this, and the protocols were not in place.
Commercial Construction Process
Client expectations can be slow to change. A client negotiates a lease, pays a deposit, and wants to know when they can move in. If the client is involved with a construction company early on, they develop layouts of the improvements, know the costs and have some expectations of the time frame. Land use approvals, permit processing and the material supply chain all contribute to the project delivery time frame.
There was a time in the not-too-distant past when the commercial construction permitting process was fairly predictable. As cities grow, regulations and requirements follow. The process in Central Oregon is no different. What was once a review followed by a permit in under 30 days can now take four to six months.
Most local jurisdictions use an electronic process where all plans, permit forms and reports are submitted and processed electronically. In some ways, this is better. The process is easier to track. On the other hand, while all that transparency is formal, it does not always follow the plan. Communication is handled over email rather than face-to-face, making this simple process one that now requires days, not hours.
As agencies become more formalized, so does the way growth is managed. System Development Charges (SDCs) are well-known in the development world. They address the immediate infrastructure impacts of development on streets and the water, sewer and park systems. SDCs account and collect for those impacts at the time of permitting. A drive-thru restaurant has a greater impact on the street system than a finance office, while a brewery affects the water and sewer systems at much higher levels than a drive-thru. The cost effects of SDCs must be accounted for as part of the project cost.
Meeting Expectations
We are collectively thankful for the situations of today and the challenges of meeting expectations. Our communication skills expanded by providing clients with up-to-date progress reports to temper waiting times. Project scheduling improved out of a necessity to manage a diminished pool of workers. Accountability is necessary and expected. Moving forward, construction companies and personnel must anticipate client’s needs and act on them to be successful.
BEND OFFICE MARKET
by Jay Lyons, SIOR, CCIM, Partner & Broker — Compass Commercial Real Estate Services
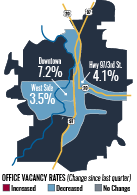 Compass Commercial surveyed 222 office buildings totaling 2.75 million square feet for the second quarter office report of 2022. The market experienced 39,876 SF of positive absorption in Q2 2022 with a decline in vacancy rate from 5.74 percent in Q1 2022 to 4.29 percent in Q2. The vacancy rate has now declined for three consecutive quarters. There is now 118,115 SF of office space available in the market.
LEASING: The office market continues to pick up steam as evidenced by the declining vacancy rate. All three submarkets experienced positive absorption this quarter, with the Westside submarket leading the way with 35,465 SF of positive absorption. The Downtown and Highway 97/3rd Street submarkets experienced more modest absorption with 2,860 SF and 1,548 SF respectively.
RENTS: Lease rates remain unchanged from Q1 with the high end of the market ranging from $2.00 to $2.85/SF/Mo. NNN and more affordable spaces ranging from $1.40 to $2.00/SF/Mo. NNN. Where a space falls within the appropriate range is dependent on size, quality and location. The Class A office product within the Westside submarket typically demands the highest rents while more affordable options are typically found within the Highway 97/3rd Street submarket. Lease rates in the Downtown submarket can vary significantly depending on quality of construction.
CONSTRUCTION: Brooks Resources and Taylor Development recently broke ground on the first phase of Shevlin Crossing, a two-building Class A office project in NorthWest Crossing, totaling approximately 45,054 SF. There are no other speculative office developments currently under construction.
SALES: There were two notable sales this quarter. An owner/user purchased the 2,984 SF office building located at 1012 SW Emkay Drive within the Westside submarket. The building sold for $1,425,000 or approximately $478/SF. An existing tenant purchased the 12,094 SF office building located at 409 NE Greenwood Avenue within the Highway 97/3rd Street submarket. The building sold for $3,000,000 or approximately $248/SF.
BEND RETAIL MARKET
by Peter May, CCIM, Partner & Broker — Compass Commercial Real Estate Services
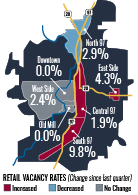 Compass Commercial surveyed over 4.58 million square feet of retail space across 261 buildings. During the quarter, 7,034 SF of negative absorption was recorded, resulting in the citywide vacancy rate to increase slightly from 3.51 percent in Q1 2022 to 3.63 percent in Q2 2022. There is now 166,473 SF of available retail space for lease.
LEASING: Retail leasing shows a sign of slowing in Q2 with a slight increase in vacancy. However, we are still seeing strong activity with a number of spaces becoming vacant and leasing up immediately. Bend Shoe Company and Nothing Bundt Cakes both leased recently vacated spaces for a total of 6,567 SF at the Forum. The East Side, West Side and Central 97 submarkets experienced the most activity this quarter. The East Side submarket saw an increase in vacancy with the closing of the Sew Many Quilts location. The Central 97 submarket had three small new vacancies and a new lease to Rife Mattress Express at 2221 NE 3rd Street. The West Side submarket recorded 3,031 SF of positive absorption, of which the entirety of this absorption was due to the new high-end restaurant Hook and Plow leasing new space in Westside Yard.
RENTS: Asking rental rates for Bend retail space range between $1.15 and $3.75/SF/Mo. NNN* with the highest rates associated with drive-thru sites and new construction.
CONSTRUCTION: Pioneer Marketplace, the former Sonic in southern Bend, Petrosa and the new development site in the North Triangle all remain in the permitting and pre-leasing phase. 1,500 SF of Pioneer Marketplace and all of the former Sonic site has been pre-leased. Building A & B and the drive-thru building at Reed South, an approximately 30,000 SF retail site located on the corner of Reed Market Road and 27th Street, are nearing shell completion, and Cascades Lakes has commenced construction on their building.
SALES: Notable sales during the quarter include the Boot Barn building at 2221 NE 3rd Street, which sold for $4,700,000 or $128.76/SF at an 8.02 percent cap rate. 35 NW Bond sold for $1,900,000 or $324.23/SF, and 933 NW Wall Street sold for $5,050,000 which is $331.47/SF.
BEND INDUSTRIAL MARKET
by Graham Dent, SIOR, Partner & Broker — Compass Commercial Real Estate Services
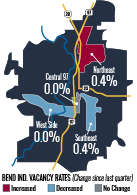 Compass Commercial surveyed 320 industrial buildings in Bend totaling 4.61 million square feet for the second quarter Bend industrial report of 2022. At the end of Q2 2022, the overall vacancy rate stood at 0.34 percent, virtually unchanged from the 0.33 percent recorded in Q1 2022.
LEASING: Demand for industrial space, particularly smaller spaces less than 10,000 SF, remained extremely high during the quarter. Leasing activity was again limited only by the severe shortage in supply. Tenants are electing to renew in-place, even at very high rates, rather than risk having to identify a new location. Most tenants are having to become more efficient in the space they occupy and in many cases taking down contiguous expansion space before it ever hits the market.
RENTS: Average asking rates for Bend industrial space are between $1.00 and $1.20/SF/Mo. NNN*. Due to the high demand for industrial space in town, Landlords are consistently achieving rates above $1.00 /SF/Mo. on new leases. Generally, smaller spaces under 2,500 SF will command rates on the higher end of this range.
CONSTRUCTION: There are no speculative industrial development projects underway. The construction occurring in the market is limited to owner/user development projects. Although rental rates are at an all-time high, so too are land prices and construction costs making speculative development a challenge.
SALES: There were a couple of notable industrial building sales during the quarter. One property located at 20739 High Desert Court sold to an investor for $2,840,000 or $218/SF which represented a 4.5 percent cap rate. Another investment sale occurred at 20576 NE Painters Street. That property sold for $3,500,000 or $191/SF and a cap rate of 5.2 percent.
REDMOND INDUSTRIAL MARKET
by Pat Kesgard, CCIM, Partner & Broker — Compass Commercial Real Estate Services
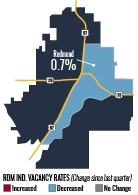 88 buildings totaling 1.66 million square feet were surveyed in the second quarter of 2022. In this quarter, the Redmond industrial market recorded net positive absorption of 2,166 SF. At the end of Q1 2022, 13,891 SF of industrial space was available in Redmond, and there is now only 11,725 SF of vacant space in Q2 2022. The vacancy rate decreased as a result from 0.83 percent in Q1 to 0.70 percent in Q2.
LEASING: Activity in the Redmond industrial market continues to increase. The 11,725 SF that is currently available came on the market during Q2 and this is indicative to how tight the market is. Demand is still growing, as is reflected in the limited amount of vacancy.
RENTS: Average asking lease rates in the Redmond industrial market are between $0.85 and $1.10/SF/Mo. NNN* depending on the condition of the space. Asking rates for new projects under construction will probably be between $0.95 and $1.25/SF/Mo. NNN.
CONSTRUCTION: There is currently 100,000 to 130,000 SF of industrial space in the pipeline for 2022/2023. Two industrial buildings at 2505 SE 1st Street totaling 58,568 SF are projected to be completed in the summer of 2022 and some leases are already signed. Another 40,000 SF industrial building located at 2502 SE 21st Street is slated to break ground at the end of 2022. Some of these buildings will be owner/user facilities, and some will be for lease. In the last few months, lumber prices have settled down to levels about where they were two years ago.
Positive Absorption = Space Leased | Negative Absorption = Space Vacated *Data sourced from CoStar
About Compass Points Market Report:
Compass Points is Central Oregon’s primary commercial real estate newsletter. Compass Commercial Real Estate Services offers comprehensive surveys of office, retail and industrial properties in Bend and Redmond, Oregon. The report provides a detailed look at quarterly vacancy and absorption data in these markets along with leasing and sales activity, rental rates, construction projects and more.
