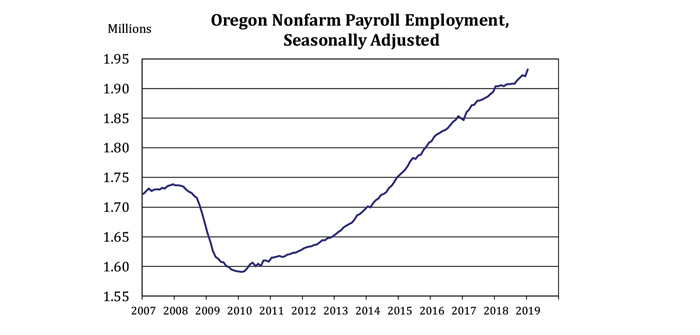
In January, Oregon’s nonfarm payroll employment grew by 11,000 jobs, following a revised loss of 1,700 jobs in December. Six industries each added at least 1,000 jobs in January. Strong gains in the goods-producing industries topped the list as manufacturing added 2,500 jobs and construction added 1,800. Four other industries added at least 1,000 jobs: retail trade (+1,600 jobs), professional and business services (+1,400), health care and social assistance (+1,400), and private educational services (+1,000). None of Oregon’s major industries cut a substantial number of jobs in January.
Oregon’s nonfarm payroll employment increased by 28,200 jobs, or 1.5 percent, since January 2018. This growth rate was in line with the most recent eight months in which annual gains averaged 29,000 jobs, but a deceleration from more than 40,000 jobs added during each of the prior five years.
In the past 12 months, transportation, warehousing and utilities grew at the fastest rate of the major industries, expanding by 3,800 jobs or 5.9 percent. Construction, which grew very rapidly in recent years, cooled somewhat in the past 12 months, as it added 4,100 jobs or 4.0 percent. Manufacturing (+6,600 jobs, or 3.4 percent) was the only other industry that grew by well over 2 percent. Contributing to the state’s overall slowing were six of Oregon’s major industries whose employment was within 500 jobs of January 2018 levels. On the downside, retail trade (-1,800 jobs, or -0.8 percent) was the only major industry to cut jobs substantially in the past 12 months.
Durable goods manufacturing has accelerated during the past four months. The industry expanded rapidly over the past 12 months, up 4.5 percent since January 2018. These component industries each posted impressive gains in that time: machinery manufacturing (+1,100 jobs, or 8.0 percent), primary metal manufacturing (+600 jobs, or 7.2 percent), semiconductor and electronic component manufacturing (+1,500 jobs, or 5.1 percent), and transportation equipment manufacturing (+500 jobs, or 4.2 percent).
Oregon’s unemployment rate was 4.3 percent in January, the same as the revised rates of 4.3 percent for both November and December. Annual revisions to the labor force data show that Oregon’s unemployment rate has ranged between 4.0 percent and 4.3 percent since December 2016, with the low of 4.0 percent occurring in May, June, and July 2018.
Notes:
All numbers in the above narrative are seasonally adjusted, except the durable goods manufacturing component industries.
The Oregon Employment Department and the U.S. Bureau of Labor Statistics (BLS) work cooperatively to develop and publish monthly Oregon payroll employment and labor force data. The estimates of monthly job gains and losses are based on a survey of businesses. The estimates of unemployment are based on a survey of households and other sources. This press release incorporates, for the first time, the annual revisions to the data for 2018 and prior years.
The PDF version of the news release, including tables and graphs, can be found at QualityInfo.org/press-release. To obtain the data in other formats such as in Excel, visit QualityInfo.org, then within the top banner, select Economic Data, then choose LAUS or CES. To request the press release as a Word document, contact the person shown at the top of this press release.
For help finding jobs and training resources, visit one of the state’s WorkSource Oregon centers or go to WorkSourceOregon.org.
Equal Opportunity program — auxiliary aids and services available upon request to individuals with disabilities. Contact: 503-947-1794. For people who are deaf or hard of hearing, call 711 Telecommunications Relay Services.


