

Key Takeaways
- Oregon ranks No. 8 nationally for fatal wet road crashes with a rate of 4.60 per 100,000 licensed drivers, 1.7 times the national average of 2.68, and the only non-Southern or Appalachian state in the top 10.
- Between 2020 and 2024, 708 people lost their lives in wet road-related crashes on Oregon roads, averaging 141.6 fatal crashes per year, or nearly three every week.
- Oregon’s rate is 190.8% higher than the combined rate of its four bordering states (1.58 per 100,000), outpacing all four neighbors by at least 1.21 points.
When the Pacific Northwest’s persistent rains settle over Oregon, they bring a kind of wet-weather driving that few other states experience with such regularity. Water saturates roads for weeks at a time during the fall and winter months, pooling on forest-lined highways and mountain passes that wind through the Cascades. Unlike the sudden summer storms that challenge drivers elsewhere, Oregon’s rainfall is steady and relentless, keeping pavement slick for extended stretches and giving tires little chance to find dry ground. Wet roads have become one of the most serious and recurring threats on the state’s roadways, particularly west of the Cascades, where annual rainfall totals are among the highest in the nation.
This analysis was conducted by Beck & Beck using data from the NHTSA Fatality Analysis Reporting System (FARS) and the Federal Highway Administration Highway Statistics Series. The study examined fatal crashes involving wet pavement conditions and loss of vehicle traction across all 50 states from 2020 to 2024, ranking each state by average annual fatal wet road crashes per 100,000 licensed drivers.
Oregon at a Glance: Fatal Wet Road Crash Profile
| Metric | Value |
| National Rank | 8th out of 50 |
| Avg. Annual Licensed Drivers (2020 to 2024) | 3,081,394 |
| Total Fatal wet road Crashes (2020 to 2024) | 708 |
| Avg. Annual Fatal wet road Crashes | 141.6 |
| Rate per 100,000 Licensed Drivers | 4.60 |
| National Average Rate | 2.68 |
| Times Above National Average | 1.7x |
| Peak Year | 2021 (161 crashes) |
| Most Recent Year (2024) | 145 crashes |
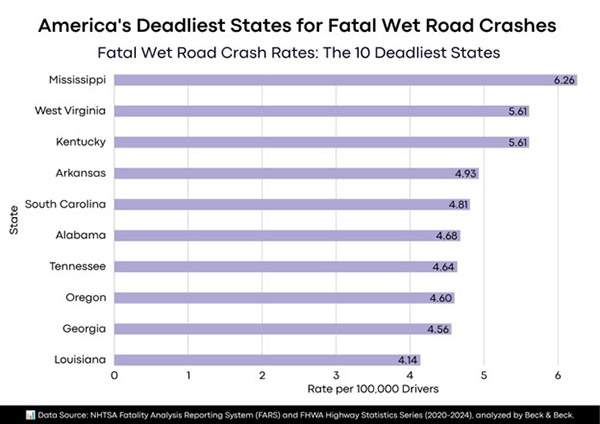
Fatal Wet Road Crash Rates: The 10 Deadliest States
| Rank | State | Avg. Annual Fatal Wet Road Crashes | Rate per 100,000 Drivers |
| 1 | Mississippi | 128.4 | 6.26 |
| 2 | West Virginia | 63.6 | 5.61 |
| 3 | Kentucky | 164.4 | 5.61 |
| 4 | Arkansas | 118.8 | 4.93 |
| 5 | South Carolina | 194.6 | 4.81 |
| 6 | Alabama | 188.0 | 4.68 |
| 7 | Tennessee | 234.4 | 4.64 |
| 8 | Oregon | 141.6 | 4.60 |
| 9 | Georgia | 347.0 | 4.56 |
| 10 | Louisiana | 141.4 | 4.14 |
Oregon ranks No. 8 with a rate of 4.60, sitting just 0.04 points behind No. 7 Tennessee and 0.04 points above No. 9 Georgia. It is the only state outside the South or Appalachia to appear in the top 10.
Oregon vs. Its Bordering States
| Rank | State | Avg. Annual Fatal Wet Road Crashes | Rate per 100,000 Drivers | Gap Behind Oregon (Points) |
| 8 | Oregon | 141.6 | 4.60 | – |
| 14 | Washington | 201.0 | 3.38 | +1.21 |
| 30 | Idaho | 30.0 | 2.19 | +2.40 |
| 46 | California | 337.2 | 1.23 | +3.37 |
| 50 | Nevada | 16.0 | 0.73 | +3.87 |
Oregon outpaces all four of its bordering states, with the widest gap of +3.87 points over Nevada and +3.37 points over California. Its rate is nearly three times the combined rate of its neighbors (1.58 per 100,000 drivers).
Oregon vs. The 10 States With the Lowest Fatal Wet Road Crash Rates
| Rank | State | Avg. Annual Fatal Wet Road Crashes | Rate per 100,000 Drivers | Gap Behind Oregon (Points) |
| 8 | Oregon | 141.6 | 4.60 | – |
| 41 | North Dakota | 9.6 | 1.70 | +2.90 |
| 42 | New Hampshire | 18.8 | 1.68 | +2.92 |
| 43 | Nebraska | 22.8 | 1.57 | +3.03 |
| 44 | Minnesota | 64.6 | 1.56 | +3.04 |
| 45 | Massachusetts | 69.6 | 1.42 | +3.18 |
| 46 | California | 337.2 | 1.23 | +3.37 |
| 47 | Rhode Island | 8.2 | 1.08 | +3.51 |
| 48 | Colorado | 48.0 | 1.08 | +3.52 |
| 49 | Arizona | 55.8 | 0.96 | +3.64 |
| 50 | Nevada | 16.0 | 0.73 | +3.87 |
Oregon’s rate is 6.3 times higher than last-ranked Nevada (0.73) and 3.7 times the combined rate of all 10 bottom-ranked states. Two of Oregon’s own bordering states, Nevada (#50) and California (#46), appear among the bottom 10.
Methodology
This study, conducted by Beck & Beck, analyzed data from the National Highway Traffic Safety Administration Fatality Analysis Reporting System (FARS) and the Federal Highway Administration (FHWA) Highway Statistics Series to identify and rank fatal wet road crashes across all 50 states from 2020 through 2024. Fatal wet road crashes were defined as fatal motor vehicle crashes involving wet pavement conditions and loss of vehicle traction as recorded in the FARS database. For each state, qualifying fatal crashes were summed across all five years and divided by five to produce an average annual count. That count was then divided by the state’s average annual licensed-driver population over the same period, multiplied by 100,000, to yield a per-capita rate. States were ranked from highest (Rank 1) to lowest (Rank 50) based on this rate.
Data Sources
National Highway Traffic Safety Administration Fatality Analysis Reporting System (FARS): https://cdan.dot.gov/query
Federal Highway Administration Highway Statistics Series: https://www.fhwa.dot.gov/policyinformation/statistics.cfm
Research Dataset: https://docs.google.com/spreadsheets/d/1jk6dej6uXe4Z5amEVBudjsVT1SR4Fmna6Y_mFM8-PVE/edit?gid=0#gid=0
Study by: https://becklawmo.com/
About Beck & Beck
Beck & Beck is a Missouri-based personal injury law firm dedicated to representing individuals and families injured in automobile, motorcycle, and other serious vehicle accidents. The firm assists clients with injury claims, insurance disputes, and accident-related litigation throughout Missouri.