(Photo above courtesy of Intrepid Marketing)
As one would expect, residential property listings and sales are growing as the High Desert moves into spring. Our statistics show that an already strong market has been surging into full bloom, even as warmer weather wakes up our beautiful natural environment. Join us as we take a closer look at trends the data are suggesting.
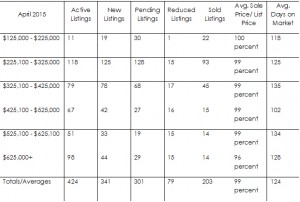
Overall, as compared with January of this year, we are seeing a flood of new residential properties entering the market and selling more quickly, while the total number active on the market is staying fairly steady. In other words, the rate at which properties are entering the market is balanced by how quickly they are selling, indicating a strong flow of buying and selling transactions. While the number of active homes on the market decreased by a meager 4.5 percent between January and April, the number of new properties entering the market during the same period increased by 108 percent.
A remarkable 80 percent of April’s active properties on the market were new listings, as compared with 37 percent in January, 47 percent in February and 67 percent in March. This increase indicates that, as our plants and animals have begun to emerge from winter’s grip, so have residential sellers.
The number of properties sold jumped from 120 in January to 203 in April, an increase of 69 percent. The biggest relative surge happened between February and March, likely due to the influx of Spring Break buyers that descend upon Central Oregon each year. The number of properties pending sale mirrored this trend, with a 68 percent increase between January-April.
More new properties are entering the market, but they are not sitting stagnant—they are selling even more quickly—an average of a month quicker in April than they were in January. Based on average Days on Market (DOM), it took about five months to sell a residential property in January, but about four months in April.
The average sales-to-listing price is very strong, meaning people are generally getting their asking price on properties (this average usually includes a small number of “outliers” on the “tails of the bell curve,” with some properties taking higher offers and some reducing price.) Interestingly, the sales-to-listing price ratio has increased very slightly on homes $125,000-$625,000 and slightly decreased on homes above $625,000. The change hasn’t been statistically significant, but merits attention to see if a trend develops.
The largest number of active properties have been in the $225,100-$325,000 range for some time, though this number decreased between February and April, even as numbers sold has increased and inventory decreased. The number of active properties in the $125,000-$225,000 and months of inventory also decreased, while number sold increased. The numbers of higher-priced properties active has been increasing overall.
The number of months of residential inventory has gone down from highs of 3.9 months in January and 4.6 in February, to 3.1 in April, indicating that the ice has been melting and real estate revenue is flowing. It’s a very good time to sell, with many people wanting to enjoy the Central Oregon lifestyle.
541-382-8262
www.dukewarner.com
April 2015 Active Listings New Listings Pending Listings Reduced Listings Sold Listings Avg. Sale Price/ List Price Avg. Days on Market


