
(Graphics courtesy of Compass Commercial Real Estate Services)
by Emilio Tiscareno, CCIM, Broker — Compass Commercial Real Estate Services
More Central Oregon businesses are answering that question with a yes. So far in 2026, owner-users have accounted for more than a quarter of Deschutes County commercial sales tracked by Compass Commercial, and nearly half of office purchases. Juniper Dermatology bought its building on NE Courtney Drive, Deschutes County bought one on NE Wyatt Court, and Columbia Distributing bought its $18.7 million facility on High Desert Lane. Compass Commercial was involved in half of these owner-user sales this year, and nearly every one started with the same question: does buying make more sense than leasing? Here’s how to think it through.
Compare the Monthly Cost
Start with what you pay today. On a triple-net lease, you already cover the property taxes, insurance, and maintenance on top of your base rent. As an owner, you keep paying those same costs, just on your own building. That makes the real comparison your base rent versus a monthly mortgage payment. For many businesses, those two numbers land closer than expected, especially with the low down payment that owner-user financing allows. Over time, the math tends to shift further in the owner’s favor. Rent typically rises every year, while a fixed-rate loan payment stays the same. And every payment pays down the loan, building equity that a tenant never sees.
Know How Owner-Users Finance
The low down payment is what makes this work for many businesses. SBA 504 and 7(a) loans are designed for owner-users and often require as little as 10% down, compared with 25% or more for a typical investor loan. That’s a big reason owner-users can outbid investors on the right building. To qualify, the business generally must occupy at least 51% of an existing building.
Plan for Growth and Your Exit
Buy for where your business will be in five to ten years. Extra space can be leased to another tenant to help cover the payment. When it’s time to move on, you can sell to another owner-user or an investor, or sell the building and lease it back to free up your equity.
If You Own a Building
Owner-users are often the strongest buyers for smaller and vacant buildings. Several small office buildings between 1,000 and 1,400 square feet sold to owner-users this year for $604 to $643 per square foot. Investors, meanwhile, price to income. This year, net-leased retail traded at cap rates of roughly 5% to 6.5%, office and self-storage near 6% to 6.5%, and smaller industrial buildings between 6.1% and 6.9%. If your building is a good fit for an owner-user, marketing it to local businesses alongside investors can widen your buyer pool and strengthen your price.
Every business is different, and the right answer depends on your cash flow, growth plans, and long-term goals. If you’re weighing whether to buy the building you operate in, or whether to sell to a business that wants one, the team at Compass Commercial is happy to run the numbers with you.
Rising Interest Rates
What Multifamily Owners Need to Know
by Ron Ross, Principal Broker — Compass Commercial Real Estate Services
We have not seen interest rates at these levels in more than 20 years. The ten-year U.S. Treasury yield, a key benchmark for commercial real estate financing, has climbed above 5%, reaching approximately 5.3% in recent weeks.
Having started my real estate career in the 1980s, I remember a very different interest rate environment. Treasury yields were in the double digits, and mortgage rates approached 17%. Imagine trying to sell real estate under those conditions!
Fortunately, we are a long way from those extremes. Nevertheless, the rise in interest rates that began in 2022 has had a profound impact on multifamily capitalization rates, property valuations, financing costs, and even operating expenses.
From their peak in 1981 to historic lows in 2020, interest rates followed a downward trajectory for 40 years. Much of today’s real estate investment market developed during that extended period of declining borrowing costs. Strong investor demand, readily available financing, and expectations of continued appreciation drove multifamily cap rates to historically low levels.
That environment has changed.
Over the past four years, multifamily cap rates have gradually moved upward. While the increase has not been as dramatic as the rise in interest rates, the direction is unmistakable. The full impact of the latest increases in Treasury yields remains to be seen.
For property owners, particularly those approaching a loan maturity, the consequences can be significant. Higher borrowing costs translate into increased debt service, while rising cap rates place downward pressure on property valuations. Appraisals are often coming in below owners’ expectations, and lenders have become more cautious with stricter underwriting standards.
The combination of higher financing costs, more conservative lending standards, and pressure on property values presents challenges that owners cannot afford to ignore.
Whether you are approaching a refinance, considering a sale, or simply planning to hold your investment, there are several proactive steps worth considering.
1. Start With Your Biggest Expenses
Review every major expense category. Shop insurance coverage competitively, establish relationships with dependable contractors, and evaluate opportunities to reduce ongoing maintenance costs. Consider replacing water-intensive landscaping with attractive, low-maintenance xeriscaping. Hire experienced property managers. A good manager may cost more initially but can generate substantial savings and improved performance over time.
2. Maximize Rental Income
Stay current with market rents and make appropriate adjustments as units turn over. Implement timely rent increases where supported by market conditions. Evaluate utility reimbursement programs to recover expenses. Even modest improvements in net operating income can have a meaningful impact on property value.
3. Keep Your Property in Excellent Condition
Do not allow deferred maintenance to accumulate. Address repairs promptly, maintain major building systems, and plan ahead for capital improvements. Well-maintained properties are more attractive to tenants, lenders, appraisers, and prospective buyers.
4. Explore all Refinancing Options Well in Advance
If your loan is approaching maturity, begin evaluating your options early. Lending terms, underwriting standards, and available loan programs can vary considerably. An experienced commercial mortgage broker can be an invaluable resource. Our Compass Commercial Multifamily Team can also help owners evaluate alternatives and connect with appropriate financing resources.
5. Consider Selling Rather Than Refinancing
Refinancing is not always the best financial decision. A sale may offer a more attractive alternative. Understanding your property’s current market value is an important first step.
6. Evaluate Seller Financing as a Potential Exit Strategy
For owners with sufficient equity, seller financing can expand the pool of qualified buyers, facilitate a transaction, and potentially provide an attractive income stream. Properly structured seller financing may also offer tax-planning advantages.
Experience matters in a changing market. The Compass Commercial Multifamily Team has represented buyers and sellers throughout Central Oregon for more than 40 years. We understand the local market, know the active buyers and sellers, and have participated in more Central Oregon multifamily transactions than virtually anyone else. Most importantly, we are local, experienced, and available to help. If you are considering a refinance, evaluating your property’s value, or exploring a sale, we welcome the opportunity to discuss your options.
BEND OFFICE
by Jay Lyons, SIOR, CCIM, Partner & Broker — Compass Commercial Real Estate Services
Compass Commercial surveyed 225 office buildings totaling 2.79 million square feet for the third quarter 2026 report. During the quarter, the market experienced positive absorption of 18,174 SF. This is the first quarter with positive absorption since Q3 of 2025. As a result, the vacancy rate is now 6.72%, having decreased from 7.38% in Q2 2026. The available sublease space also decreased from 36,789 SF in Q2 to 31,777 in Q3, resulting in an overall availability rate of 7.86% in Q3 2026 compared to 8.69% in Q2.
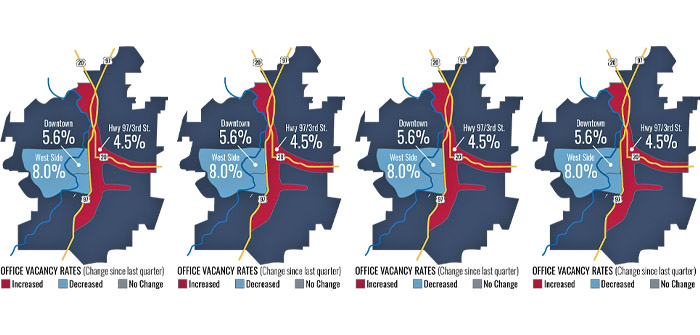
LEASING: Despite the positive absorption this quarter, leasing activity remains sluggish with limited activity and spaces sitting on the market for longer periods of time. The Westside submarket experienced the most improvement this quarter with 12,693 SF of positive absorption. The Downtown submarket also experienced 6,904 SF of positive absorption. The Hwy 97/3rd Street submarket was the outlier with 1,423 SF of negative absorption.
RENTS: Lease rates remain flat, with the high end of the market ranging from $2.00–$3.15/SF/Mo. NNN and more affordable space ranging from $1.40–$2.00/SF/Mo. NNN.
CONSTRUCTION: No speculative office buildings are currently under construction in Bend.
SALES: Q3 office sales activity included three notable transactions: The 26,632 SF multi-tenant office building at 1001 SW Emkay Drive sold in August for $7,250,000, or $272/SF, to an investor. The building was 100% leased at sale. Additionally, a 5,909 SF multi-tenant office building at 595 SW Bluff Drive sold in July for $1,850,000, or $313/SF. The buyer was an owner/user who intends to occupy a portion of the property. The building was partially leased at sale. Lastly, the 3,954 SF multi-tenant medical office building at 199 SW Shevlin Hixon Drive sold in July for $2,180,000 or $551/SF. The building was purchased by an existing tenant and was 100% leased at sale.
BEND RETAIL
by Eli Harrison, Broker — Compass Commercial Real Estate Services
Compass Commercial surveyed over 4.63 million square feet of retail space across 276 buildings in Bend for the third quarter 2026 report. During the quarter, the market saw negative absorption of 8,516 SF, a reversal from the positive 19,333 SF in Q2. As a result, overall vacancy edged up from 3.95% in Q2 to 4.26% in Q3, though it remains below the 4.40% rate a year ago. Over the past year, absorption has gone back and forth between positive and negative quarters. Even so, the market has posted net positive absorption of 8,269 SF year-to-date.
LEASING: The Central district saw the largest shift of any Bend submarket, recording 9,500 SF of negative absorption that pushed its vacancy rate from 2.29% to 3.66%. The Westside posted 1,090 SF of positive absorption, although newly delivered space at Jackstraw lifted its vacancy rate to 5.87%. The Old Mill District remained fully leased up, and Downtown saw a modest uptick to 1.25%. The Eastside submarket improved slightly, falling from 8.96% to 8.69% vacant.
RENTS: Asking rental rates in Bend currently range from $1.00 to $3.75/SF/Mo. NNN, with an average of $2.12/SF/Mo. NNN. Drive-through pad sites remain the exception to this range, with several being marketed for lease between $5.00/SF/Mo. and $5.42/SF/Mo.
CONSTRUCTION: Killian Pacific’s Jackstraw joined our survey this quarter with 18,116 SF of new retail, and only 1,110 SF remain available for lease. SolTerra broke ground on CASCADA, a hotel and thermal spa with two restaurants, and the Old Mill District is gearing up for its 31,000 SF north-end expansion.
SALES: Notable retail sales this quarter include the combined sale of 407 SE 3rd Street and 415 SE 3rd Street in Bend, a total of 7,958 SF, for $1,975,000, or $248.18/SF. In Redmond, the 2,130 SF retail sales office at 1357 NW 6th Street sold for $1,170,000, representing $549.30/SF. Also in Redmond, the 4,476 SF restaurant building located at 1362 S Hwy 97 sold for $1,130,000, or $252.46/SF.
Bend Industrial
by Graham Dent, SIOR, Partner & Broker — Compass Commercial Real Estate Services
Compass Commercial surveyed 336 industrial buildings in Bend totaling 4.87 million square feet for the Q3 2026 report. The market experienced 62,781 SF of negative absorption during the quarter. As a result, the overall vacancy rate rose 129 basis points, from 4.38% in Q2 to 5.67% in Q3. Bend currently has 276,429 SF of industrial space available. Even after this quarter’s increase, the vacancy rate remains relatively low for the market.
LEASING: The industrial market experienced modest leasing activity during this second quarter, with the Northeast and Central submarkets recording 23,366 and 23,863 square feet of positive absorption, respectively.
LEASING: Realms Middle School and High School vacated 82,000 SF during the quarter from a building in the Northeast submarket. This one departure caused the vacancy rate in that submarket to jump from 5.33% in Q2 to 7.43% this quarter. Otherwise, leasing activity remained steady during the quarter. One large new lease of approximately 25,808 SF was signed for the former FedEx facility on Jamison Street, which helped offset the negative absorption attributed to the Realms vacancy.
RENTS: The average asking lease rate for raw industrial space increased marginally from $1.14/SF/Mo. at the end of Q2 to $1.15/SF/Mo. at the end of Q3. State-of-the-art new industrial buildings are commanding rents between $1.65-$1.85/SF/Mo. NNN, while second-generation industrial/flex spaces are leasing in the $1.50-$1.65/SF/Mo. NNN range.
CONSTRUCTION: One speculative industrial project is currently under construction. That project is located at 20800 Sockeye Place and consists of 11,509 SF, of which 4,700 SF is available for lease. Taylor Brooks completed construction of NOCO at Juniper Ridge. This first phase, located at the Northwest corner of Cooley Road and 18th Street NE, consists of three industrial/flex buildings totaling 62,429 SF.
SALES: A few notable sales occurred during the quarter. One of those was an investment sale of a multi-tenant building located at 1560 NE 1st Street for $2,430,000 or $137/SF. Another was a single-tenant building with excess land located at 625 SE 9th Street that sold for $1,525,000 or $337/SF. Lastly, a building located at 20810 Sockeye Place sold to a private investor for $2,325,000 or $139/SF.
REDMOND INDUSTRIAL
by Kristie Schmitt, CCIM, Broker — Compass Commercial Real Estate Services
Compass Commercial added two industrial buildings to its Q3 2026 survey, bringing the total to 101 buildings comprising approximately 1.91 million square feet in Redmond. During the quarter, the market posted negative absorption of -28,193 SF. That erased the positive 26,439 SF gained in Q2 and was the market’s weakest quarter of the past year. Several large vacancies, along with the newly added buildings, pushed the vacancy rate up to 9.98% from 5.84% last quarter. Three of the last four quarters have had negative absorption. That leaves net absorption at -11,901 SF year-to-date and -25,175 SF over the trailing four quarters, compared with positive absorption of 16,526 SF in Q3 2025.
LEASING: Leasing activity remained modest in Q3, with continued interest from small-to-mid-sized industrial users.
RENTS: Industrial asking rents ranged from approximately $0.85-$1.70/SF/Mo. NNN with specialty-use and first-generation space commanding the upper end of the range. Some landlords continue to offer leasing incentives to attract tenants.
CONSTRUCTION: Construction has been completed on an approximately 47,000 SF speculative industrial building at 2020 SW Deerhound Avenue. No other notable industrial construction is underway.
SALES: No notable industrial sales closed in Q3 2026.